Comment faire pour obtenir un système performant ?
Les systèmes informatiques sont très complexes : chacun de leurs composants individuels est complexe, et la manière dont ils interagissent l’est encore plus.
Pour obtenir un système performant, il faut maîtriser cette complexité.
Pour acquérir cette connaissance, Richard L. Sites propose de :
-
Décrire le fonctionnement général des quatre composants d’un système ayant la plus forte influence sur la performance (processeur, mémoire, disque et réseau),
-
Pour chacun de ces composants détailler les métriques qui permettent de mesurer son comportement et la manière de les obtenir,
-
Expliquer comment évaluer l’ordre de grandeur de la performance attendue d’un système pour pouvoir aiguiller les investigations en cas de lenteur,
-
Montrer comment se servir des différentes métriques pour identifier les sources d’écarts entre performance attendue et performance constatée, en allant de cas très simple jusqu’à des des situations plus complexes complexes, d’abord pour chaque composant isolément puis en les combinants.
L’auteur propose ainsi une méthode à suivre et fournit les outils pour être en mesure de l’appliquer.
Une des hantise de l’auteur est de perdre du temps en analysant un système en fonction de la manière dont on pense qu’il fonctionne, plutôt que de mesurer et d’observer la manière dont il fonctionne réellement.
Avec plusieurs dizaines d’années d’expériences sur le sujet, il sait très bien mettre les choses en perspectives et trouver des exemples parlant, le tout sans trop se mettre en avant.
Le livre ne descend pas trop dans les détail de tel ou tel processeur ou disque dur, mais permet de comprendre le fonctionnement général des composants modernes. Ainsi pour les processeurs, l’auteur explique les différents types de cache mais pas la performance individuel de chaque instruction.
Dans mon travail, je suis peu confronté à des problèmes requérant ce niveau de connaissance sur ces composants de bas niveau.
Par contre, les deux constituants du livre m’ont semblé utiles :
-
la méthode proposée par l’auteur s’adapte facilement à d’autres sujets de performance,
-
la description générale des composants me permet de mieux comprendre la conceptions d’outils de plus haut niveau auxquels j’ai à faire et donc de mieux les utiliser.
Je me suis donc permis de survoler certaines des parties les plus spécifiques, ce qui n’interfère pas avec la compréhension globale.
Pour des personnes ayant peu d’expérience avec les sujets de performance ou de parallélisme et voulant s’y frotter je pense que le livre fait une bonne introduction au sujet, expliquant comment fonctionnent les verrous, comment plusieurs composants s’exécutant en parallèle peuvent se gêner… Attention cependant à ne pas perdre de vue les périmètres où ces sujets sont importants : on peut vite se prendre au jeu et passer du temps à se préoccuper de questions de performances dans des cas où elles ne sont peu importantes.
Un avertissement : pour visualiser les comportements décris, l’auteur utilise de nombreux graphiques, générés par un outil décrit dans le livre.
Malheureusement, sur un appareil de petite taille, les graphiques sont parfois difficiles à déchiffrer, voir quasiment illisibles.
Prenez-le en compte si vous pensez acheter le livre en version électronique.
Quelques citations
The hard part of performance analysis is observing what programs are actually doing rather than the simpler imagined picture in the readers (or original designer’s) head of what the programs are expected to be doing.
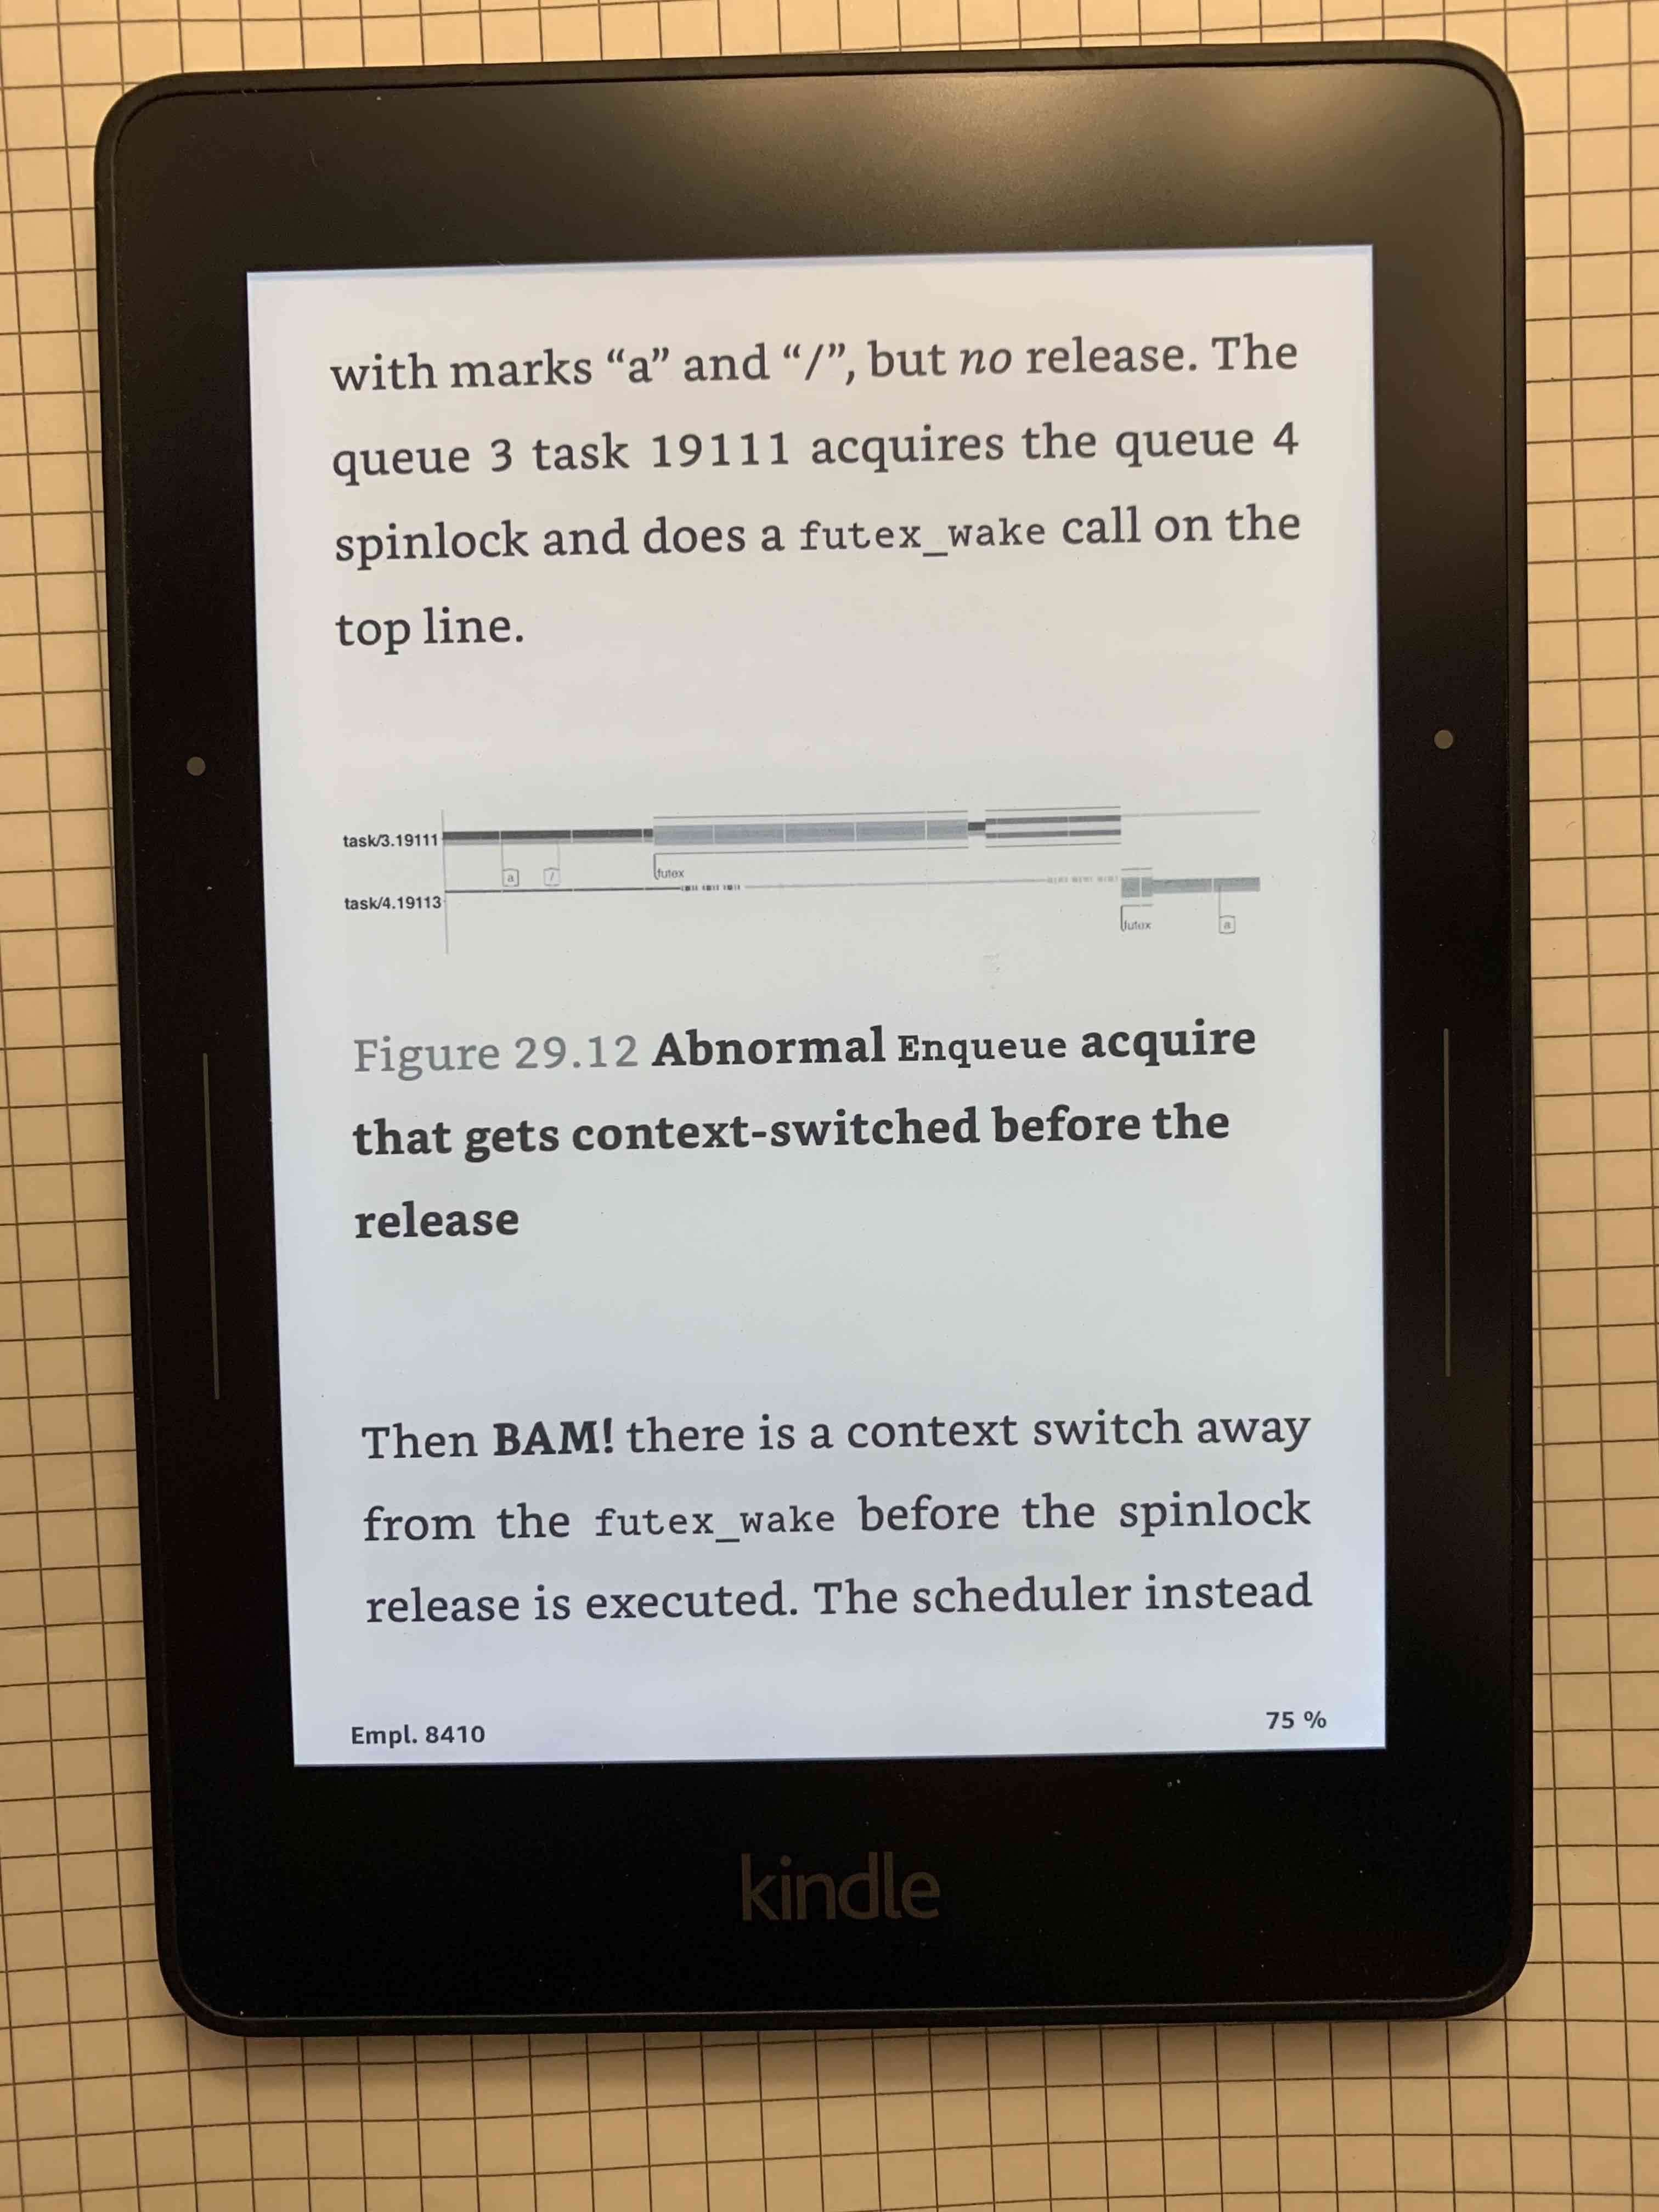
The term lock saturation refers to a lock that is contended almost all the time, preventing effective parallel execution.
The term lock capture refers to a single thread repeatedly acquiring and releasing a lock before others have a chance.
The term starvation refers to a thread that is unable to gain access to a lock for a long time, even if none of the other threads holds the lock very long.
These three effects will occur in almost any heavily contended locking system unless the design explicitly counteracts them.
Over time, lightly contended locking systems tend to become heavily contended. A lightweight technique for stating the expected lock-acquisition time and then continually comparing against that will alert code owners as delays creep up.
Observing the actual dynamics of locking interactions is the key to understanding the slowdowns they cause.
In Part I, “Measurement”, you learned to make informed estimates of how long a piece of code should take. Your careful measurements of CPU, memory, disk, and network activity inform those estimates. Estimates give you some idea of what to expect when you observe the actual behavior of a program. When the estimated and actual performance differ, there is always something to learn — why your estimate was unrealistic, why the program is slower (or faster) than it should be, or a little of each.
Along the way, you learned a little more about how modern complex processor chips work and how they interact with operating systems and user software.
In Part II, “Observation”, you learned of the existence of several common tools for observing program performance. You also learned how to design-in ways to observe the overall behavior and health of demanding time-constrained software systems. Logging and dashboards are key design ideas for built-in observability. Once you have even simple logging and dashboards in place, it is easier to add some more detail as you come to understand the dynamics of a complex software system and thus come to understand what other data items are most useful (just avoid slowing everything down too much).
Part II also introduced the contrast between sampling and tracing: the former gives low-overhead snapshots of what a program is doing via counts, PC samples, and such; the latter gives a blow-by-blow accounting of everything a CPU system is doing while executing one or more programs. Sampling is useful for observing the overall behavior of a software system and especially for understanding its normal or average behavior — what is happening. Tracing is useful for observing actual instances of unpredictable slow dynamics, either by observing long enough to have a trace contain many examples of slow behavior or by tracing continuously (flight-recorder mode) until software detects some bad performance and then stops tracing in order to capture the events leading up to and including the bad behavior. These instances lead to understanding why software is sometimes slow.
Along the way, you also learned more about the dynamic execution of request-driven time-constrained software.
In Part III, “Kernel-User Trace”, you learned how to construct kernel hooks to capture the fundamental transition events between kernel-mode execution, user-mode execution, scheduler execution, context switches, and idle. You learned how to keep the overhead of these hooks incredibly low — less than 1% CPU and memory overhead for 200,000 events per second per CPU core. This part also taught how to construct a loadable module to do most of the work underlying the kernel hooks and how to construct a simple user-mode library to control tracing. These hooks are available as open-source code for Linux on common x86 and ARM processors.
You learned the value of recording a little extra information: the first argument and return value of system calls: wakeup events that make a blocked thread runnable again; instructions per cycle to reveal execution interference from related threads, unrelated other programs, and the operating system itself; low-power idle states that can cause delays restarting execution; PC samples to give insight into long execution paths either within kernel code or user code; CPU clock frequency to avoid looking for other explanations of 5x slower than normal execution speed; and simple network stack packet timestamping to disambiguate whether a long delay from machine A user code to machine B user code occurred before A’s kernel code sent a message or after B’s kernel code received it, or in the network itself.
Starting with raw traces and postprocessing them, you learned how to extend small timestamps to full-size ones and how to turn first-use event names into running human-readable names for every trace item.
From the expanded events, you learned how to turn transition timestamps into execution spans that cover 100% of the time on every CPU core in a trace and to produce readable JSON files that can be further modified, embellished, and searched. Finally, you learned how to turn the JSON files into dynamic HTML files that the user can pan and zoom, for examining execution dynamics at any desired level of detail. Several side programs can be used to trim traces, add kernel routine names, add user routine names, and add timestamped tcpdump packet information.
With traces from two or more communicating machines, you learned how to align the timestamps via postprocessing software even when the original machines' time-of-day clocks are out of sync by tens of milliseconds, all without requiring fancy high-precision hardware. The last portion of this part explained how to use the existing HTML user interface in a browser to find and display the events, execution dynamics, and interactions that lead to slow performance. Observing exactly where all the time went in an instance of a slow time-constrained request leads directly to an understanding of the root cause(s) that make it slow—not just the what but the why.
In Part IV, “Reasoning”, we went through several case studies, learning how to reason about instances of the nine common mechanisms that can slow down time-constrained software. Throughout these examples, you also learned more about what to look for as you approach a performance mystery. The examples draw upon most of the concepts covered in the first three parts of the book, giving you the opportunity to practice using them and to consolidate your learning from those chapters.